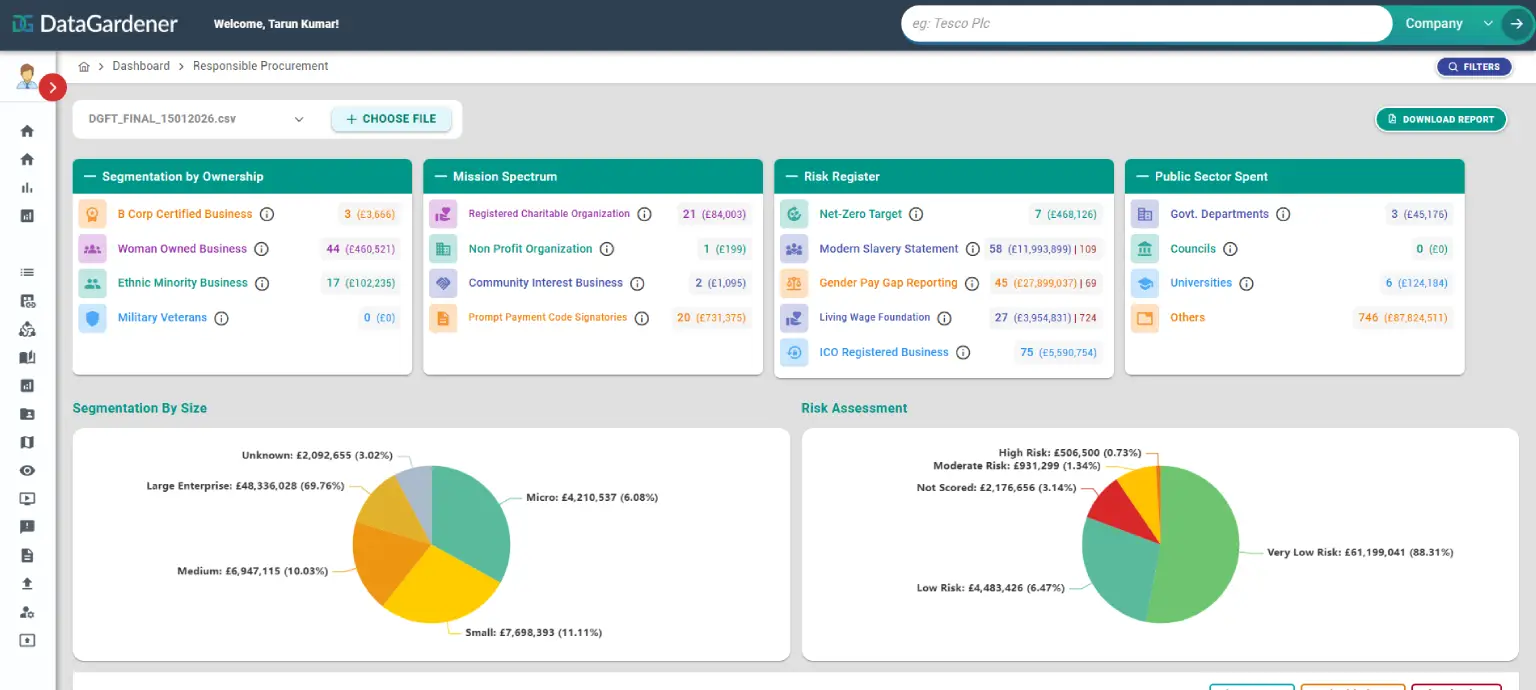
The Smarter Way to Classify, Analyse and Grow Your UK Supplier Base
Search 5 million+ active UK companies by ownership, mission, risk and size and get instant clarity on who you are buying from, how much, and where to improve.
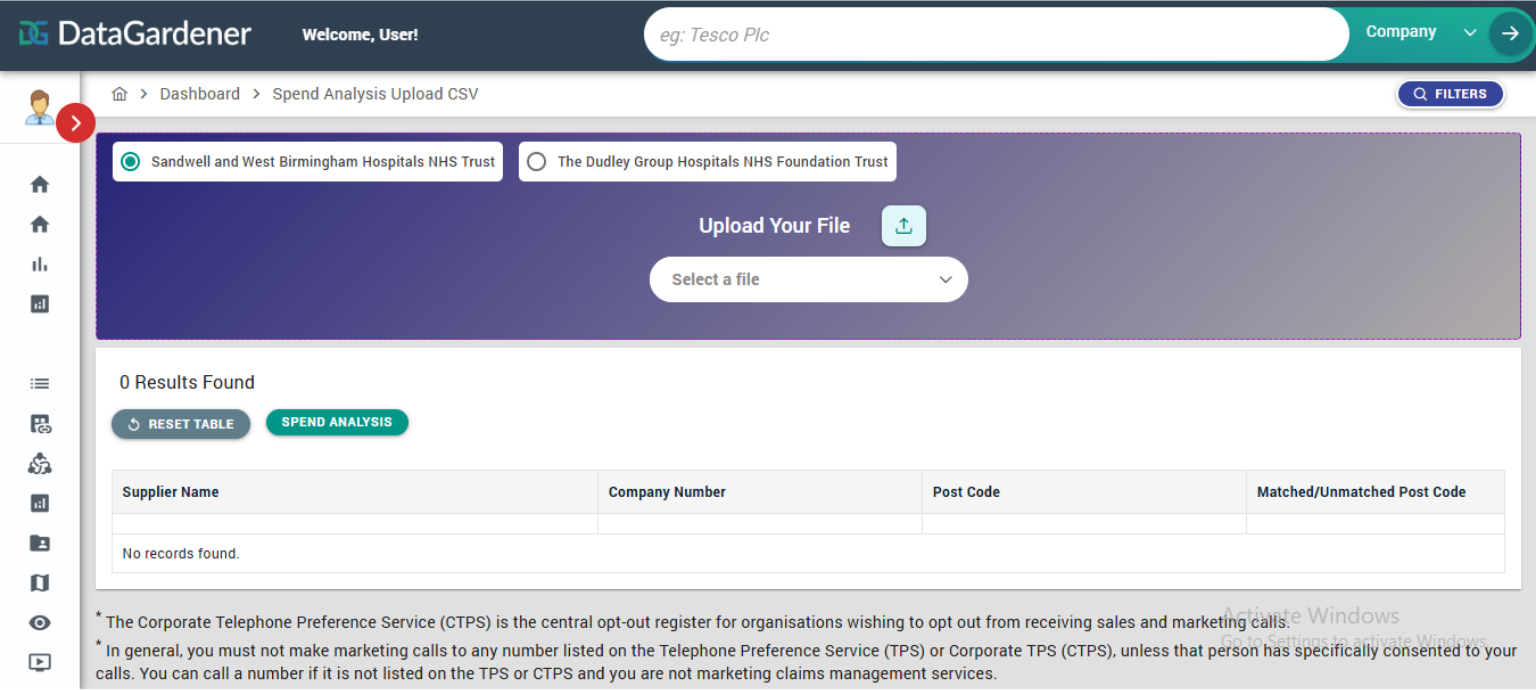
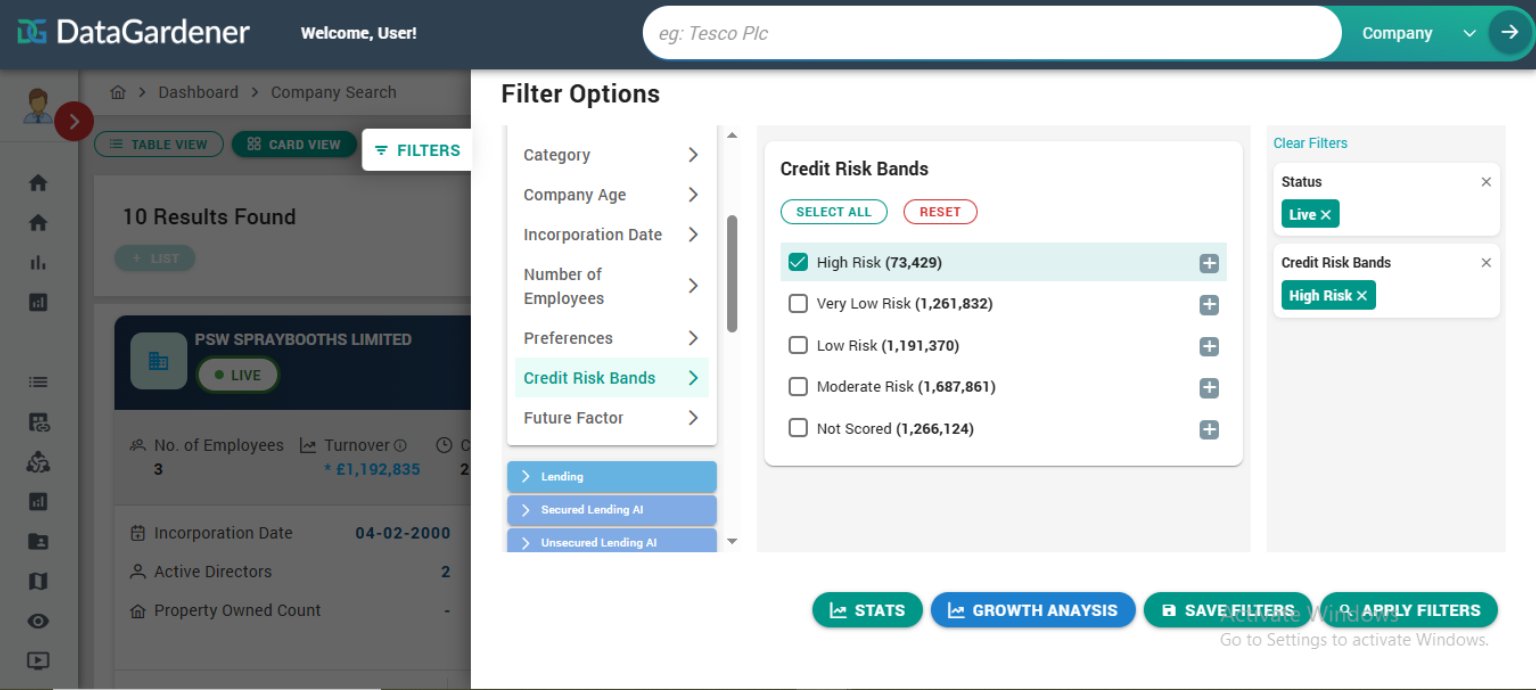
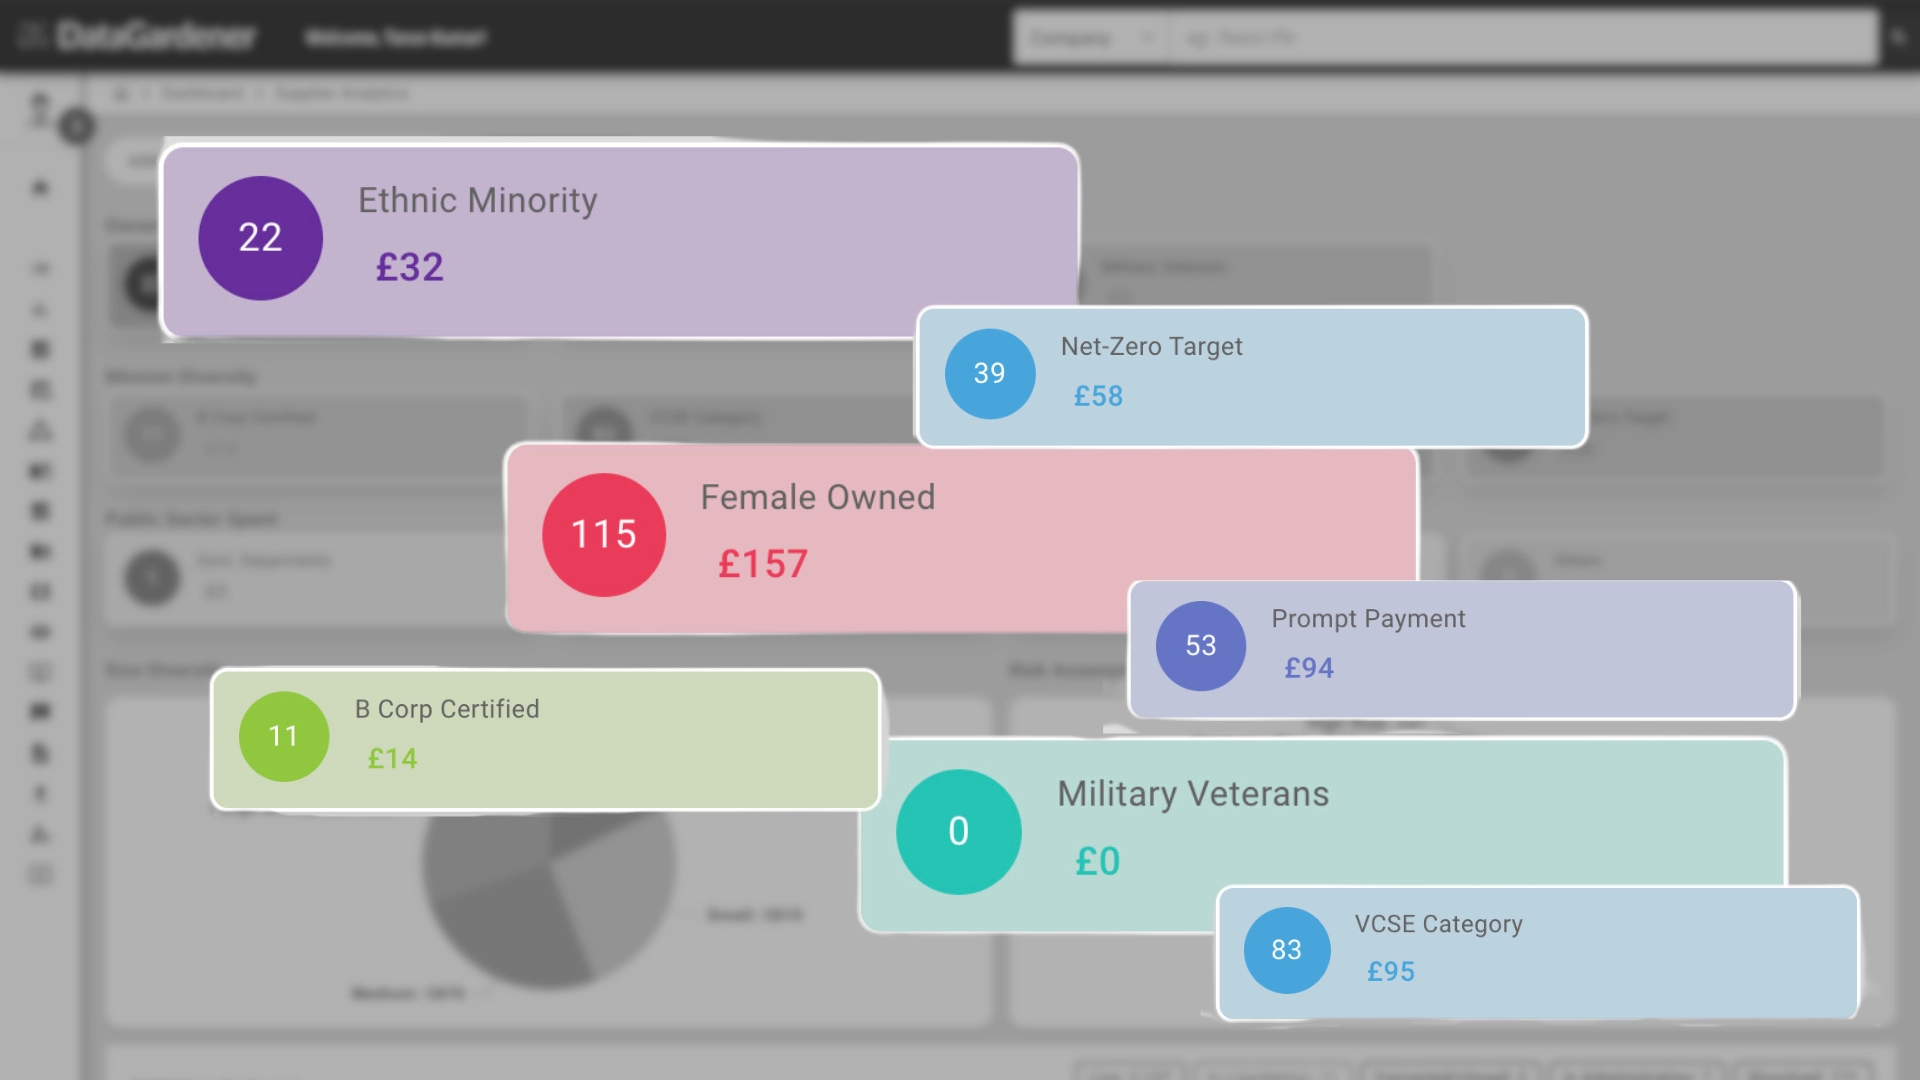
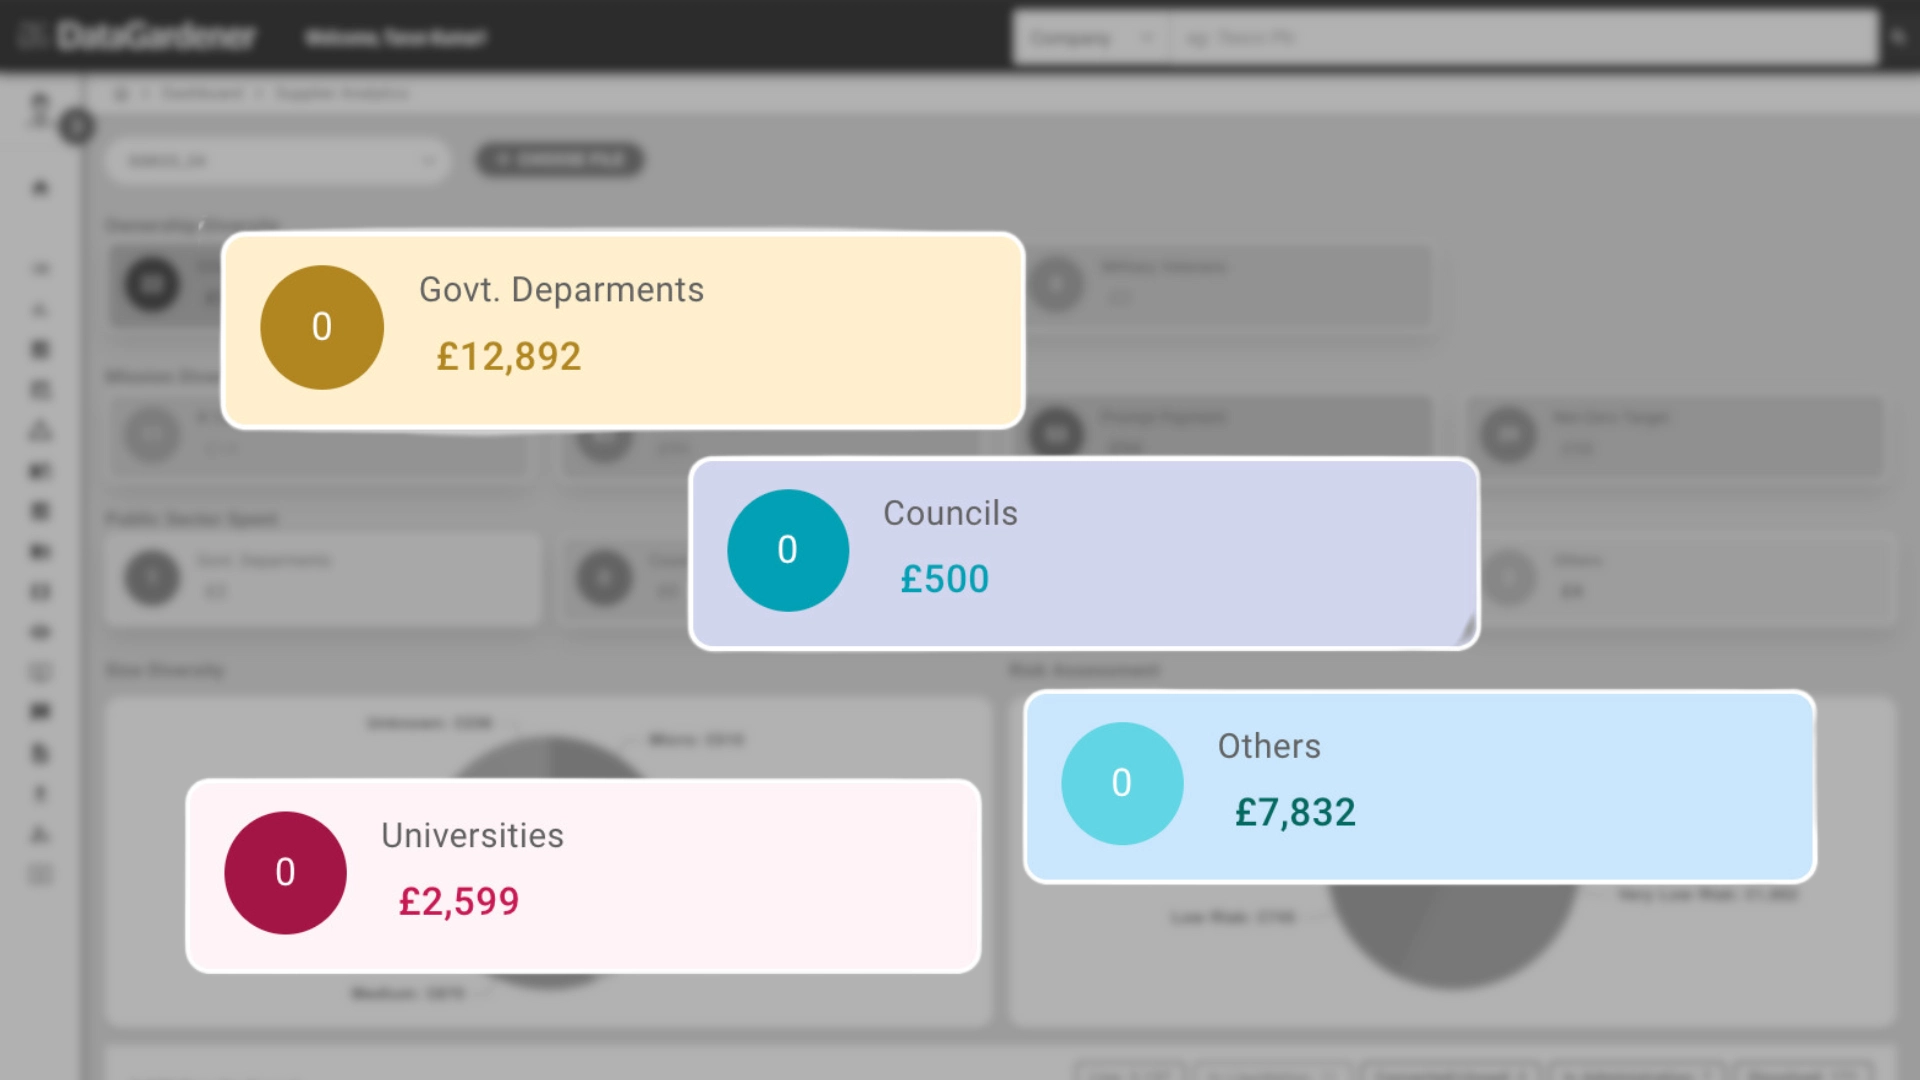
Use the tool below to explore our live database of UK companies. Filter by diversity tag, business size, sector or credit risk and then download your shortlist instantly.
Companies Count: -
×