

A Quarter of Growth on the Surface and Pressure Underneath
The third quarter of 2026 changed the UK’s central economic story for the third time in three quarters. The economy kept growing and households grew more confident, yet the company register told a harder story: for the first time in our quarterly series, more businesses closed than opened.
Explore the key trends, emerging risks and Q4 watch-points in this quarter’s DataGardener UK Market Report.
Why was Q3 2026 such an important quarter for UK businesses?
Q3 opened with the Middle East conflict apparently contained by the 17 June memorandum of understanding, and Brent crude back in the low $70s. It did not last. US strikes on 8 July and a stalled negotiation over the Strait of Hormuz pushed Brent to roughly $106 a barrel by mid-September, and UK wholesale gas to 207 pence per therm.
Politics moved just as quickly. Andy Burnham became the UK’s seventh Prime Minister since 2016, and the country entered the run-up to an Autumn Budget on 28 October under Chancellor John Healey.
Against that backdrop, GDP grew 0.4% in July and the composite PMI recovered from 49.3 in June to 52.0 in September. Consumer confidence reached -13, its highest reading since August 2024. But headline CPI inflation rose from 2.6% in June to 3.1% in August on a surge in motor fuel prices, and the Bank of England now projects inflation of about 3.75% in Q4 2026 and slightly above 4% in early 2027.
The economy, in short, entered the autumn growing, but with cost pressure returning.
Business Overview: Q3 2026 at a Glance
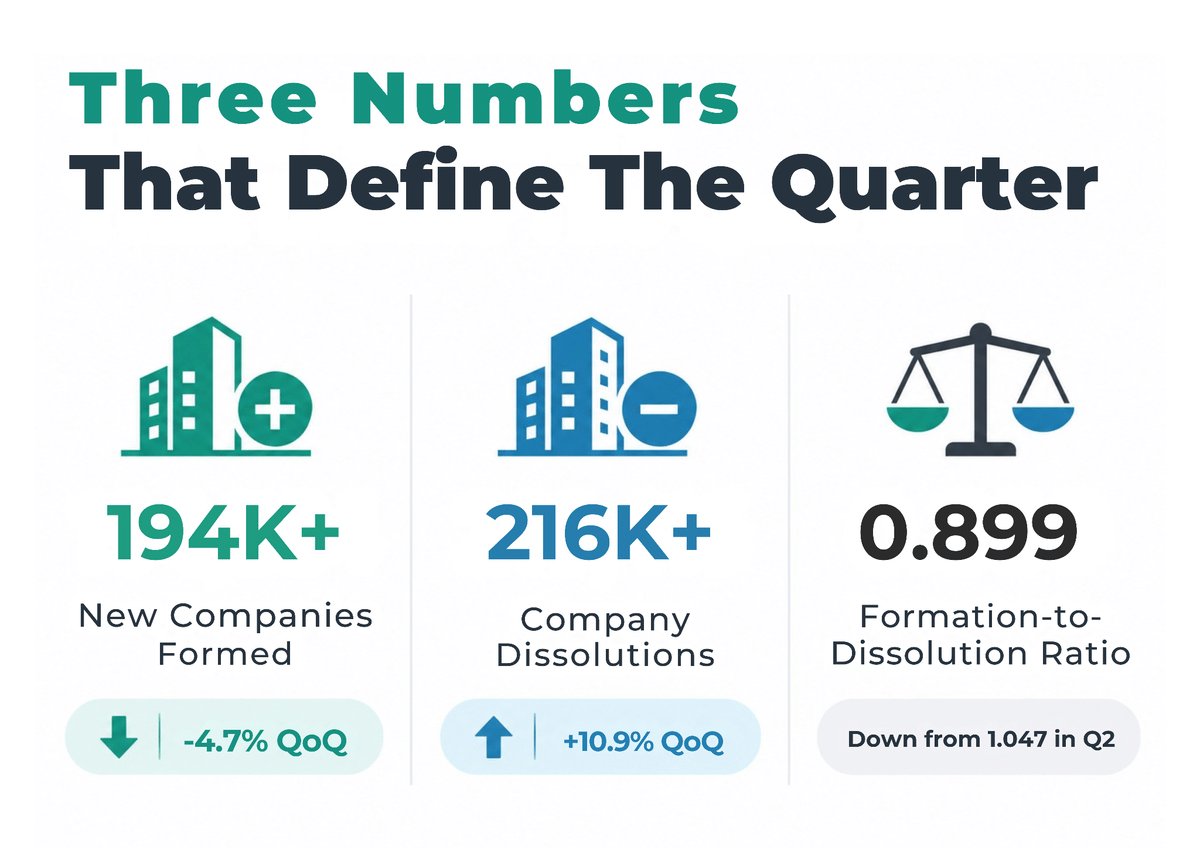
Taken together, these figures show a business base that is still building, but is shedding companies faster than it is adding them as costs rise again.
How many companies closed down in Q3 2026?
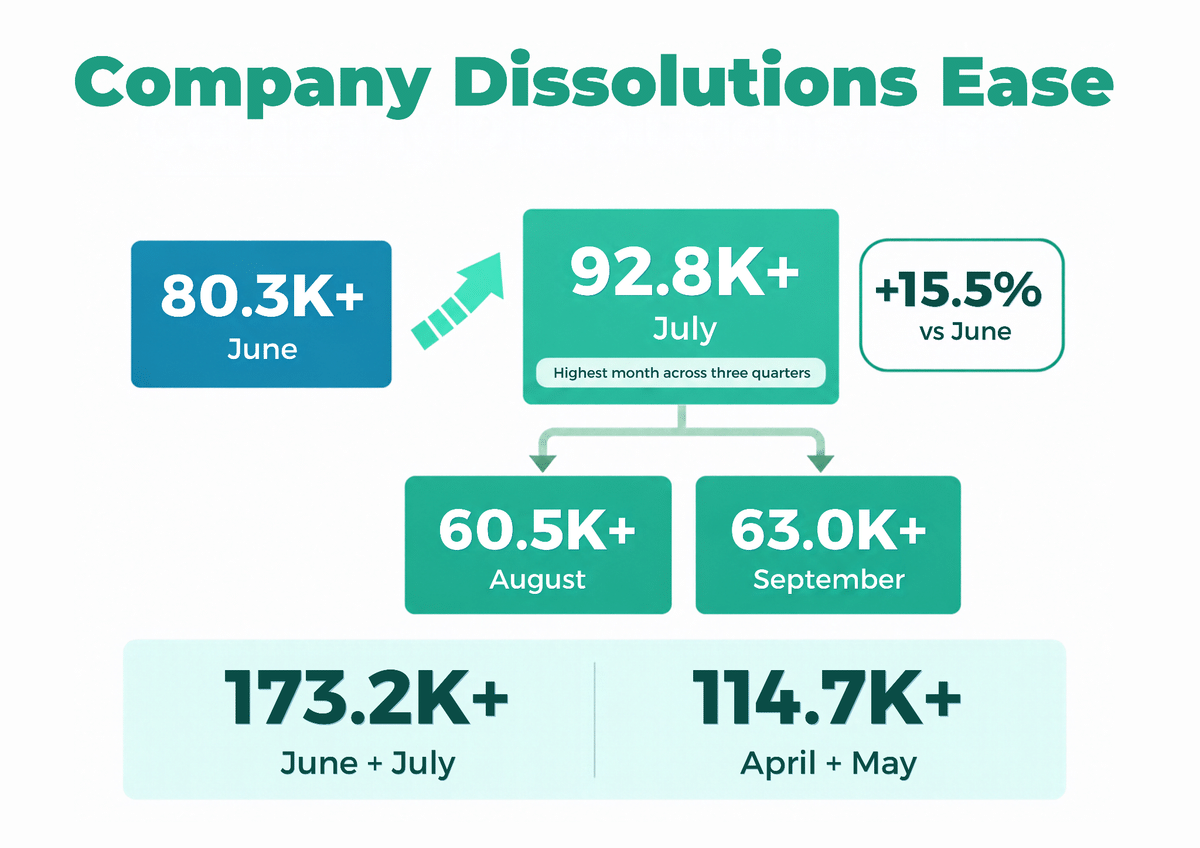
Dissolutions rose 10.9% to 216K+, up from 195K+ in Q2. July alone recorded 92K+ dissolutions, the largest monthly count across the three quarters and 15.5% above June’s 80K+, itself the previous record. They then eased to 60K+ in August and edged up to 63K+ in September.
This helps answer the question we left open in our Q2 report. The June spike was not a one-off blip. The data point to a concentrated, front-loaded clearance of non-filing companies, followed by a modestly higher underlying run-rate: the August and September average of around 62K+ a month sits 7.7% above the April and May average of 57K+.
How did new company formations compare to Q2?
New formations fell 4.7% to 194K+, from 204K+ in Q2, and sit 4.2% below Q1’s 203K+. Monthly formations were 68K+ in July, dipped to 58K+ in August (the seasonal low), and recovered to 68K+ in September.
Net of dissolutions, the register lost about 21.8K+ companies in the quarter, against a net gain of 9.2K+ in Q2. The formation-to-dissolution ratio fell from 1.047 to 0.899, the first reading below 1.0 in the series covered by our Q1, Q2 and Q3 editions.
Which regions saw the most new business activity?
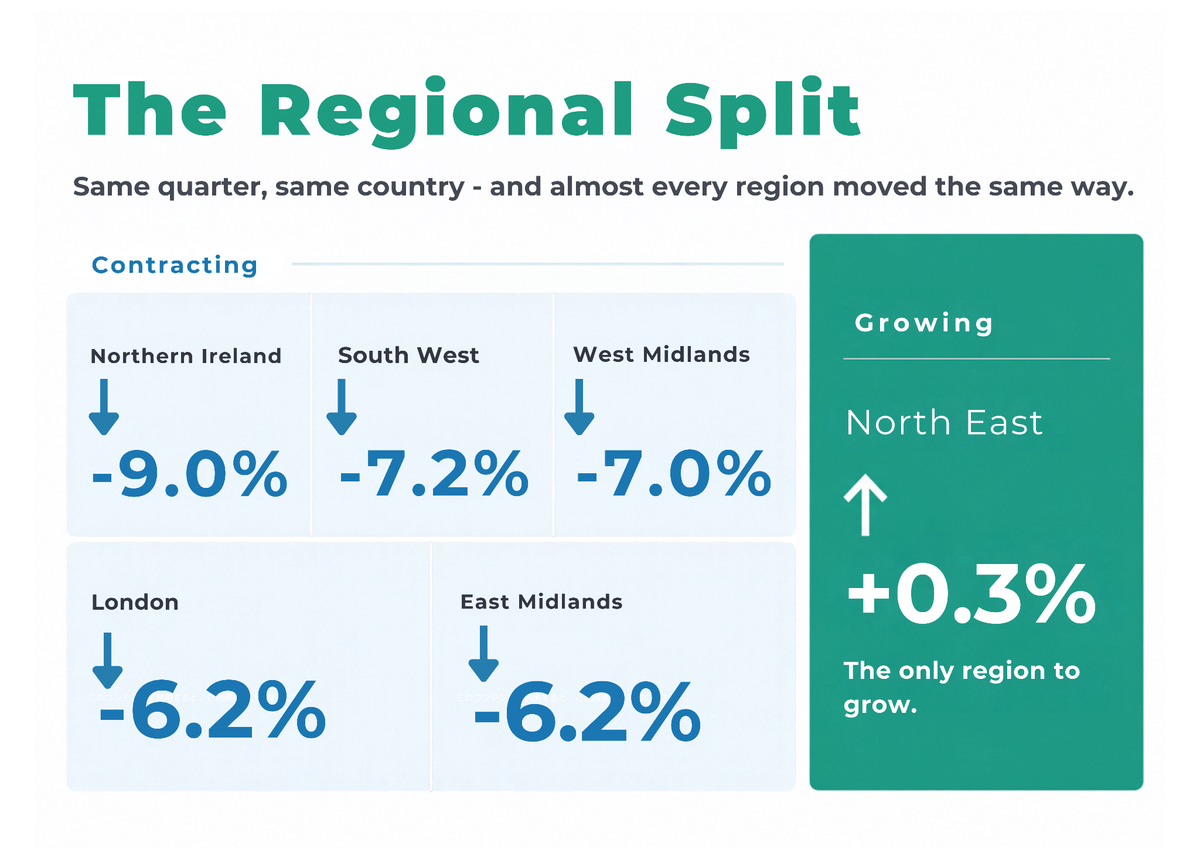
Formations fell in eleven of twelve regions. London remained dominant with 66K+ new companies, 34.3% of the total, though that is down from 34.8% in Q2 and the capital’s formations fell 6.2% on the quarter.
Northern Ireland recorded the sharpest fall at 9.0%, from the smallest base of any region, followed by the South West (down 7.2%) and the West Midlands (down 7.0%). The East Midlands matched London at down 6.2%. The North East was the only region to grow, up 0.3%.
As always, one quarter’s regional movement should not be over-read, but the breadth of the decline suggests a national rather than local effect.
Which industries were most active in Q3 2026?
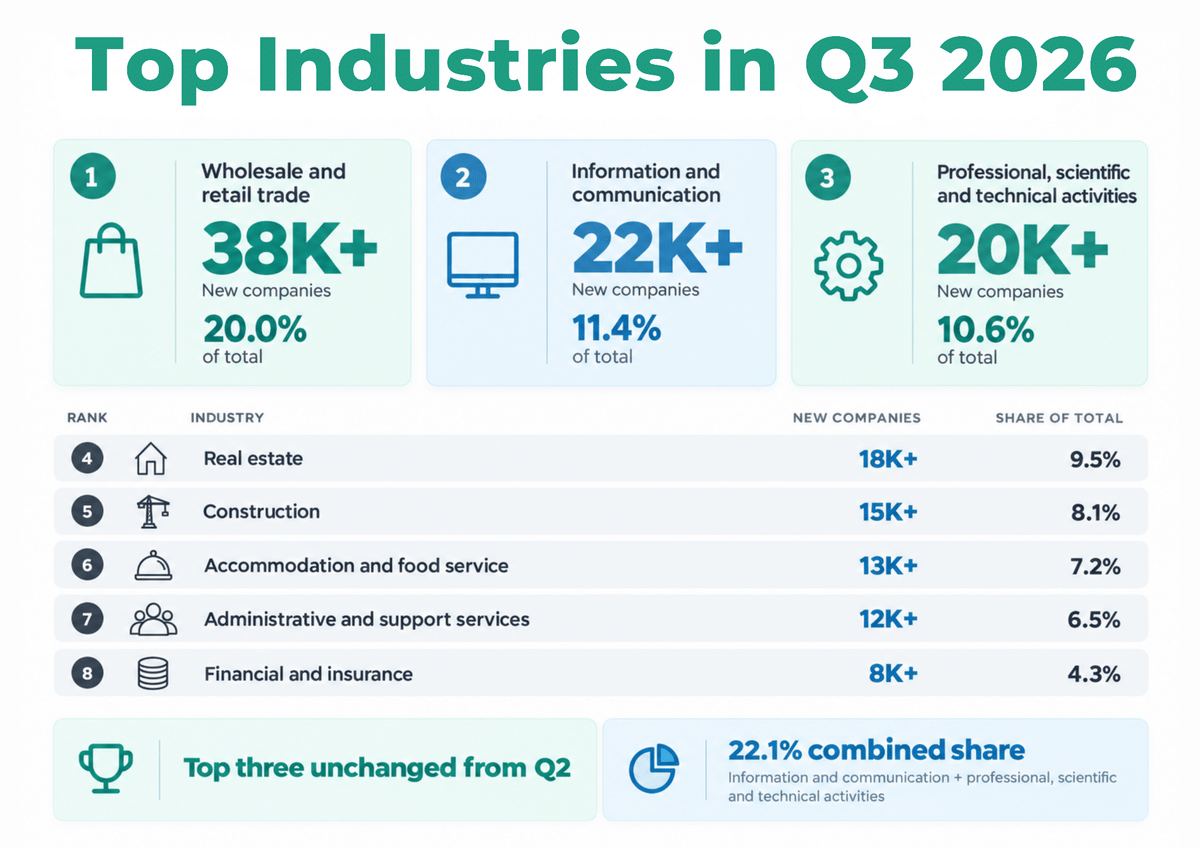
Real estate (18K+, 9.5%) and construction (15K+, 8.1%) completed the top five, with accommodation and food service (13K+, 7.2%), administrative and support services (12K+, 6.5%) and financial and insurance (8K+, 4.3%) behind them.
The top three matches the ordering in our Q2 edition. It is also encouraging that information and communication and professional services, two of the fastest-growing sectors in output terms, together accounted for 22.1% of new companies.
Were there changes in company charges registered?
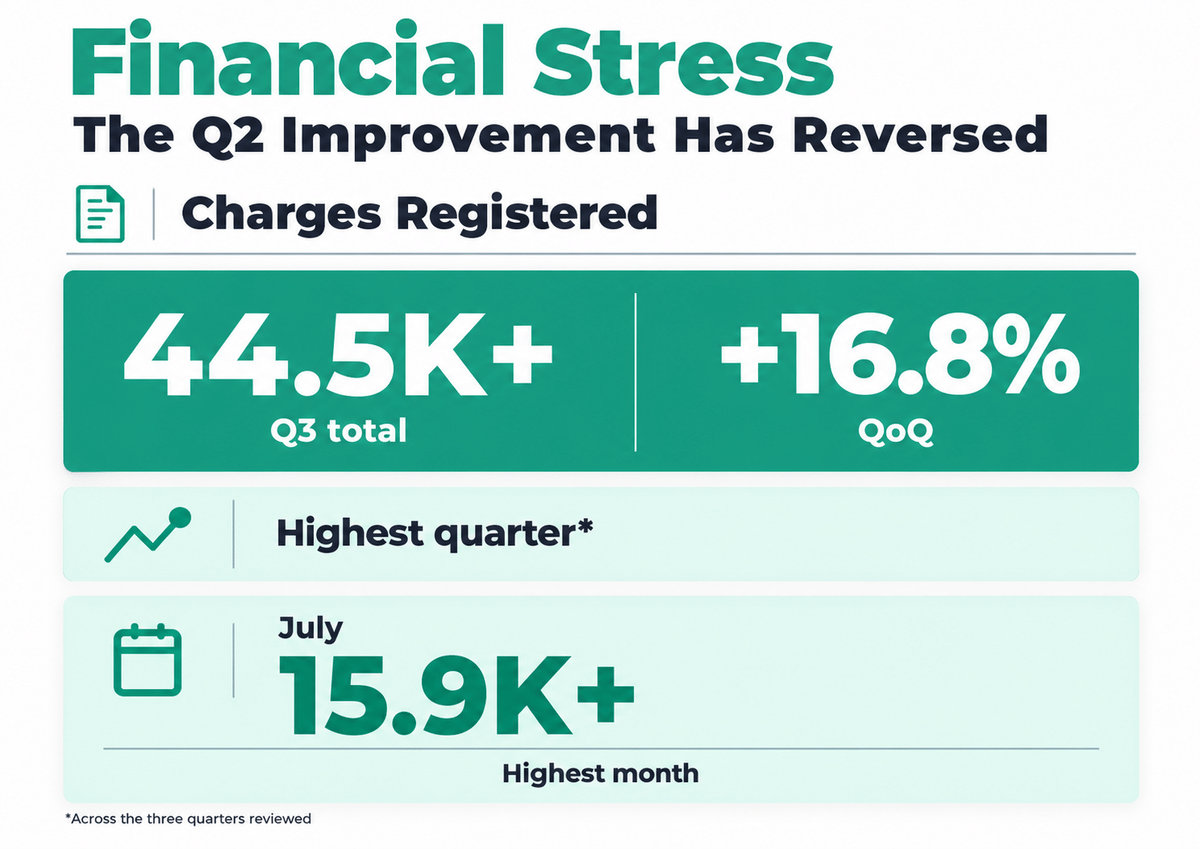
Charges registered rose 16.8% to 44K+ from 38K+, the highest quarterly total of the three quarters. July’s 15K+ was the highest single month, and rises were seen in eleven of twelve regions, led by Wales (up 15.2%), the North West (up 12.3%) and the East of England (up 12.0%). London rose 8.6% to 11K+.
A rise in charges can be read two ways: businesses securing finance to invest, or lenders tightening security on existing facilities. Read alongside rising CCJs and dissolutions, our working view is that the second reading is more likely, though the data cannot separate the two.
What about County Court Judgments (CCJs)?
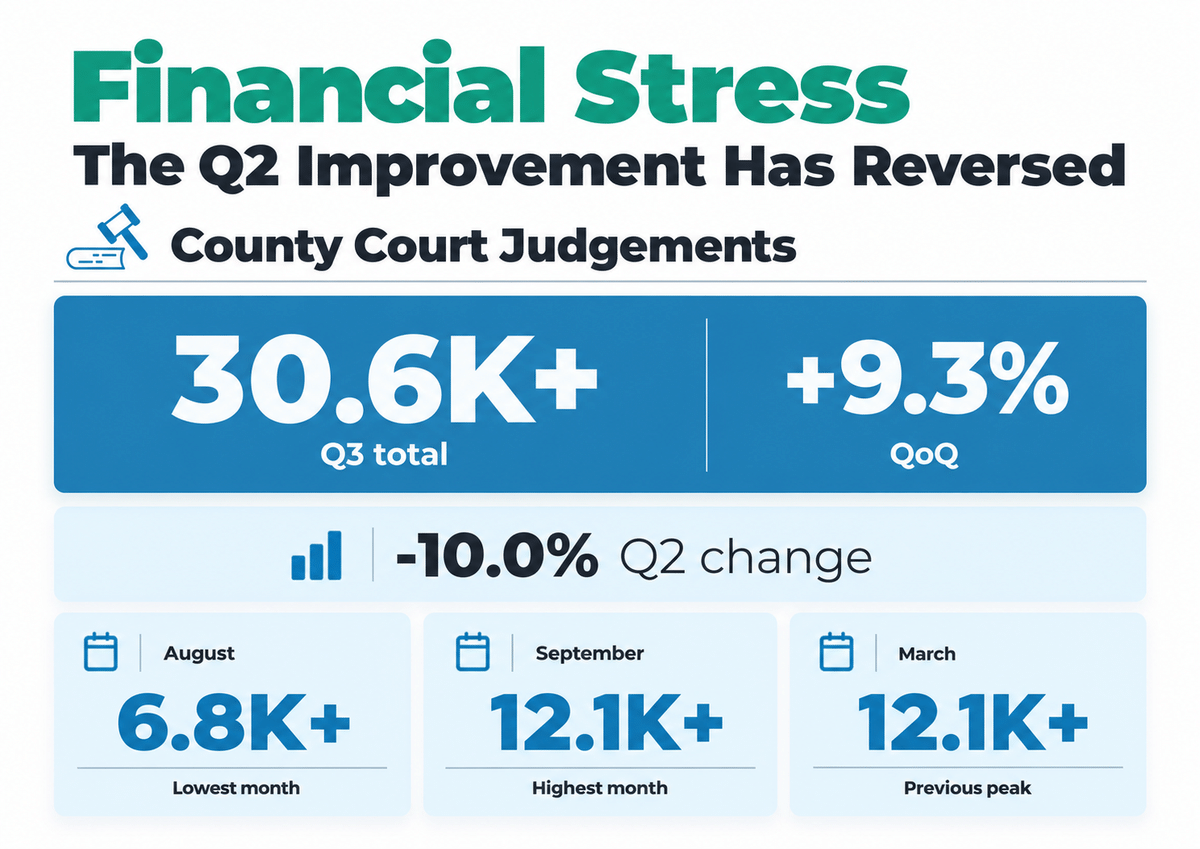
CCJs rose 9.3% to 30K+, reversing most of Q2’s 10.0% fall to 28K+, which our last report called the most encouraging indicator of that quarter. September’s 12K+ was the highest month in the quarter, suggesting stress building into the autumn.
CCJs rose in ten of twelve regions, led by Wales (up 12.7%), the East of England (up 8.1%) and Northern Ireland (up 7.6%). Scotland (down 6.3%) and the North East (down 0.4%) bucked the trend.
How are female founders performing?
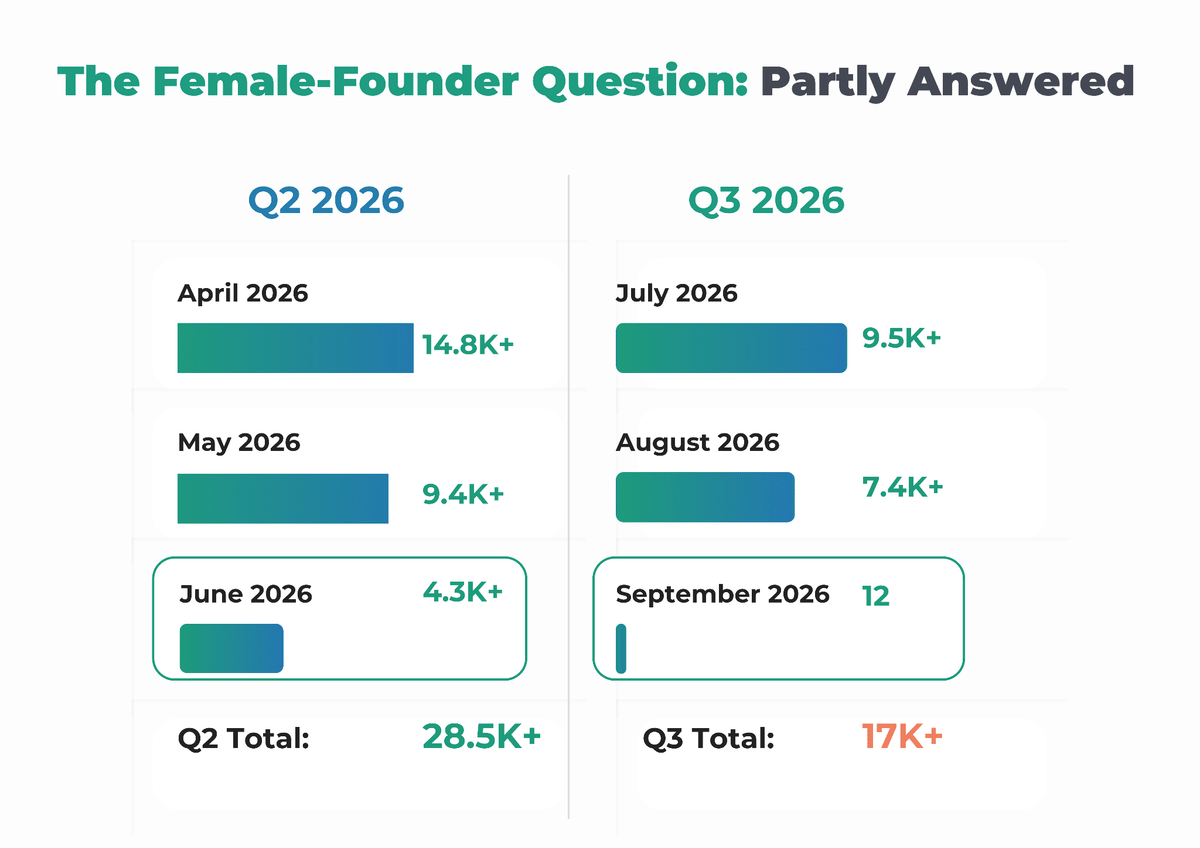
The July and August share of new companies was 14.0% and 12.8% respectively, or 13.4% across the two months, against 14.0% in Q2 and 18.2% in Q1. The industry mix broadly resembled the wider market, led by wholesale and retail (19.2%), professional, scientific and technical activities (13.9%) and information and communication (9.0%), which points to a broad-based effect rather than a sector-specific shock.
Our September female-founded count is still being finalised, so we have chosen not to publish a quarterly figure we cannot stand behind. Until then, 13.4% is the working indicator, and the structural question raised in Q1 and Q2 remains open.
What does the Q4 outlook look like?
We see three principal risks for the final quarter of 2026:
- Energy and the Strait of Hormuz. Brent near $100 and high gas prices put the energy channel back at the centre of the outlook, and businesses on flexible energy contracts face the largest near-term exposure.
- The 28 October Budget. Public sector borrowing is still above the Office for Budget Responsibility’s forecast, and the balance struck between fiscal discipline and cost-of-living support may matter more to the corporate cost base than any single measure.
- The business failure run-rate. If dissolutions continue at around 62K+ a month, Q4 will again see dissolutions exceed formations, since Q4 formations are seasonally subdued.
Key dates to note are 28 October (Autumn Budget), 5 November (Bank of England decision, with three members already voting for a rise) and 18 November, when the Economic Crime and Corporate Transparency Act identity verification deadline falls for existing directors and persons with significant control.
Conclusion: What does Q3 2026 tell us about the UK business landscape?
Q3 was the quarter in which the resilience of the company register gave way to the cost pressure that surveys and prices had been signalling for two quarters. Formations slipped, dissolutions climbed, and both CCJs and charges reversed the improvement seen in Q2. Meanwhile, households grew more confident, creating a consumer-business divergence: sentiment may be improving, but corporate balance sheets are absorbing costs now.
As the Budget and the Bank of England’s next decision approach, one thing is clear:
Businesses that combine data-driven insight with early warning on credit, cost and counterparty risk will be best placed to navigate a fourth quarter defined by energy prices and fiscal decisions.
All insights are sourced from DataGardener’s UK Quarterly Market Report for July to September 2026, which tracks 17.2 million company records across more than 40 verified UK sources. Q3 figures are first-print and may be revised.
Download the Full Q3 2026 UK Market Report
Get the complete picture. The Q3 2026 UK Market Report brings together company formations, dissolutions, charges, CCJs, regional and sector trends, female-founder data, and the macroeconomic and policy context behind them in one comprehensive resource.
Download Full Report
Whether you are a business developer, credit analyst, investor or strategic planner, this report gives you the data intelligence to make smarter, faster decisions going into the Budget and the final quarter of the year.
For deeper analysis, API access or customised dashboards, visit DataGardener.com.